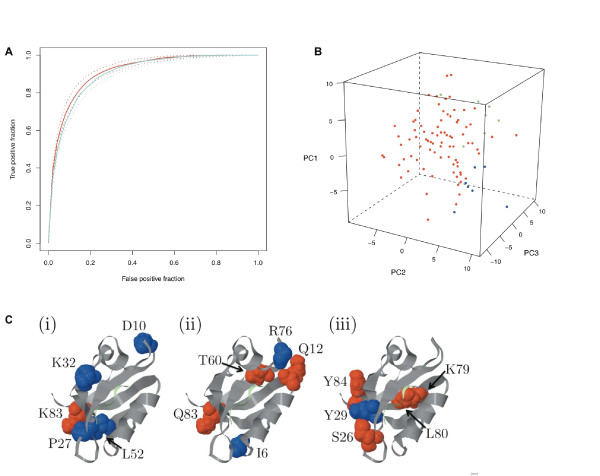
Figure 5.
Model III results. (A) The ROC curves for Model III; the red and blue lines show the results when the prior information was or was not used, respectively. Solid lines denote the mode of the ROC curve distribution, and the dotted lines the 95% Bayesian confidence intervals. The area under the curves (AUC) are 0.92 (0.89;0.93) (red) and 0.90 (0.87;0.92) (blue). (B) Trends in differences between different PDZ domains were obtained by allowing the regression coefficients to vary with PDZ domains, and then subjecting the resulting matrix of regression coefficients to a principal component analysis (PCA) and plotting the PDZ domains in the space of the first three principal components. It should be noted that the regression coefficients are evenly distributed, which supports the relaxation of the canonical PDZ classes proposed in e.g. Stiffler et al. [22] and Tonikian et al. [37]. The regression coefficients from interactions in C. elegans (green dots) and D. melanogaster (blue dots) cluster together in the outskirts of the mouse interactions (red dots).(C) Differences in predicted networks between different PDZ domains. Five residues (spacefilled) located outside the binding pocket that were estimated with Model III to be allosterically linked to residues in the binding peptide (light green) in representative PDZ domains: (i) mouse α1-syntrophin(1/1), (ii) D. melanogaster Lap4(2/4), and (iii) C. elegans Lin7(1/1). The network residues are color coded according to the physicochemical property that is estimated to be important for the network: blue = size; red = polarity.

