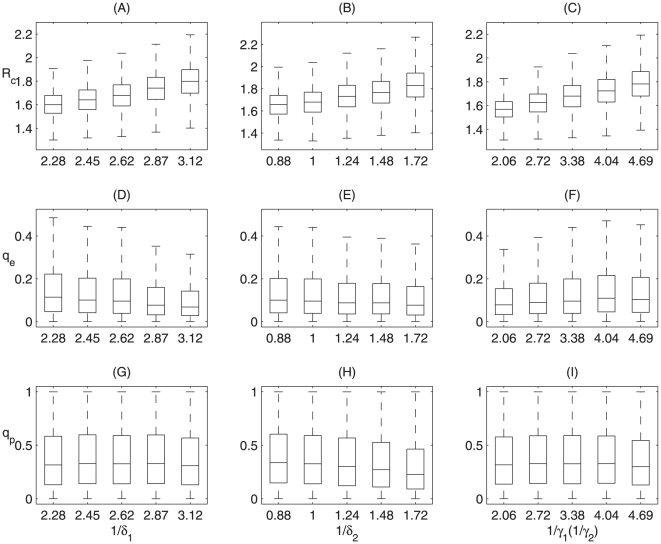
Figure 2. Sensitivity of the reproduction number and quarantine rate on model parameters.
Sensitivity analyses for the effect of durations of latency and infectiousness before the onset of symptoms, and duration of infectiousness following symptoms onset on  (A, B, C); on the fraction of exposed individuals who are quarantined during the latency (D, E, F) and pre-symptomatic infection (G, H, I), on the basis of model
  .
.

