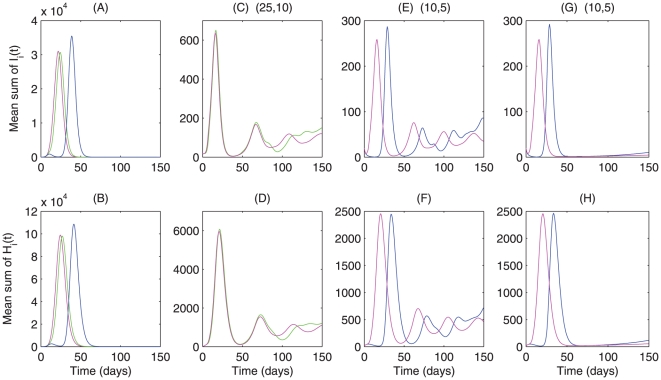
Figure 4. Effects of local quarantine, hygiene precaution and Fengxiao on the A/H1N1 influenza outbreaks in the province of Shaanxi.
Numerical integrations of model  are given in S1 Appendix D. 500 independent simulations are carried out. Mean sum of
  and mean sum of
  are plotted by employing (A–B) case 1, magenta curve without Fengxiao, green curve with
  and blue curve with
  ; (C–D) case 2a (3a), magenta (green) curve with
  ; (E–F) case 2a (3a), magenta (blue) curve with
  ; (G–H) case 2b (3b), magenta (blue)curve with
  . We fix the small world network structure as dispersal pattern.

