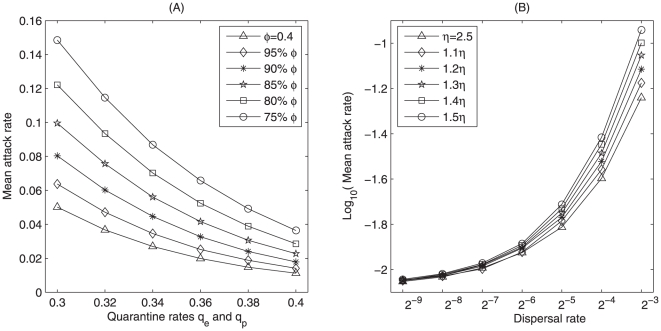
Figure 6. Effect of local control measures and nationwide travel on mean attack rate.
We fix the small world network as dispersal pattern. 200 independent simulations are carried out by employing Appendix D(case 4). Mean attack rates versus (A) quarantine rates and hygiene precaution rate for the model  ; (B) dispersal rate and transport-related transmission rate for the model
  .
.

