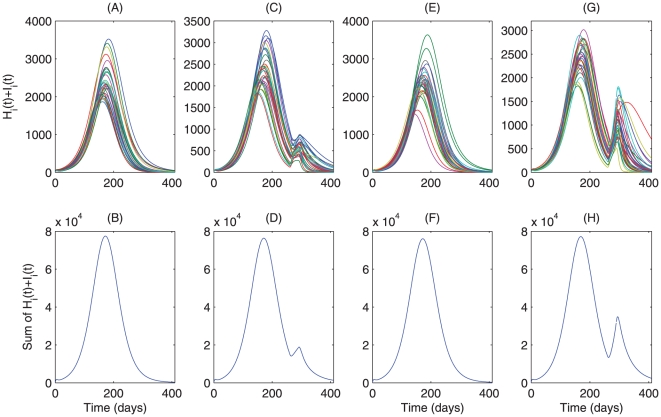
Figure 7. Effect of nationwide travel and infection during travel on A/H1N1 influenza outbreaks.
We fix the small world network as dispersal pattern. Numerical integrations of model  given in Appendix D(case 4) are employed.
  and summation of
  for all 32 patches in a single simulation are plotted for the model
  (A–B) with weak dispersal and low transmission during travel; (C–D) with large dispersal after day 260; (E–F) with high transport-related transmission rate after day 260; (G–H) with both large dispersal and high transport-related transmission after day 260.

