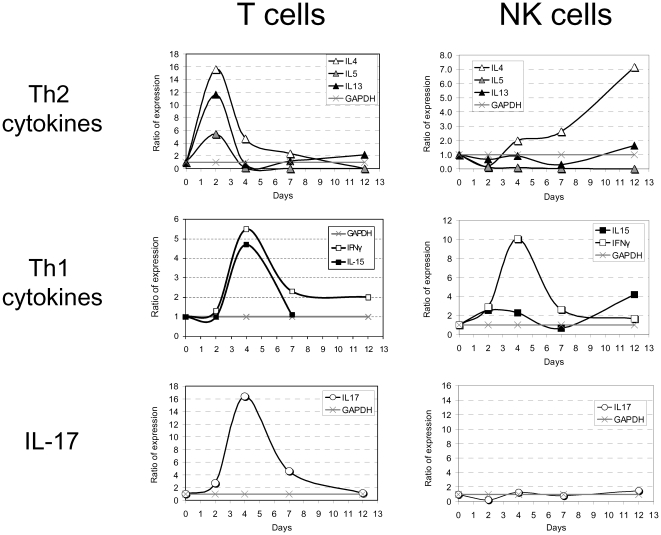
Figure 3. Cytokine expression profile in purified pulmonary T and NK cells following infection with 0.1×LD50.
Figure shows the expression ratio (see below) of cytokines categorized into three groups (indicated on the left) in two main purified pulmonary lymphocyte subpopulations, NK and T cells, at indicated time points following infection with 0.1×LD50. The quantity of cytokine transcripts was determined as described in Materials and Methods.

