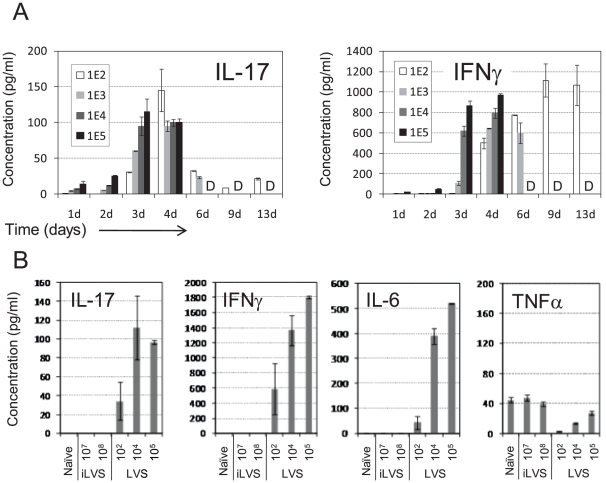
Figure 4. Accumulation of cytokines in the respiratory tracts following intranasal infection with LVS.
(A) IL-17A and IFNγ concentrations in BALFs of mice infected with various infective doses at the indicated time points. Each of the concentration values represents the mean of 2–3 BALFs collected from individual animals. The letter “D” indicates that the mice infected with the corresponding infective doses could not be measured due to death of the animals. (B) The mean concentration of the indicated cytokines three days post instillation of PBS (naïve), inactive (iLVS) or live (LVS) bacteria. Each of the concentration values represents the mean of 2–3 individual BALFs. Representative experiment out of three performed is shown in panels A and B.

