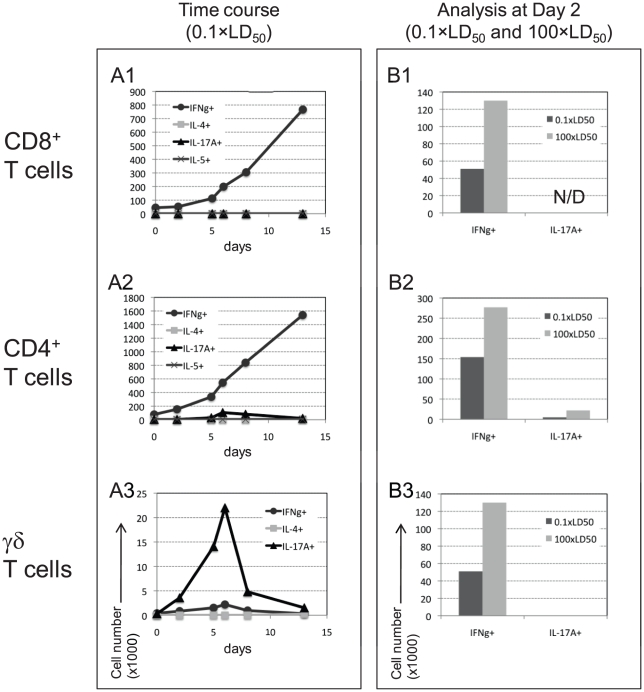
Figure 5. Expression of cytokines by specific pulmonary T cell subpopulations following intranasal infection.
Three T cell subpopulations (indicated on the left) were examined for expression of selected cytokines. Panel (A1–A3) show the number of positive cells, stained intracellularly for the production of the indicated cytokines at the indicated time points following infection with 0.1×LD50 LVS; (B1–B3) compare the number of cells expressing IFNγ or IL-17A at day 2 post infection with 0.1×LD50 (black bars) or with 100×LD50 (gray bars). N/D stands for Not Detected. Cells were analyzed from three pooled animals at each time point. Figure depicts a representative experiment out of three experiments performed.

