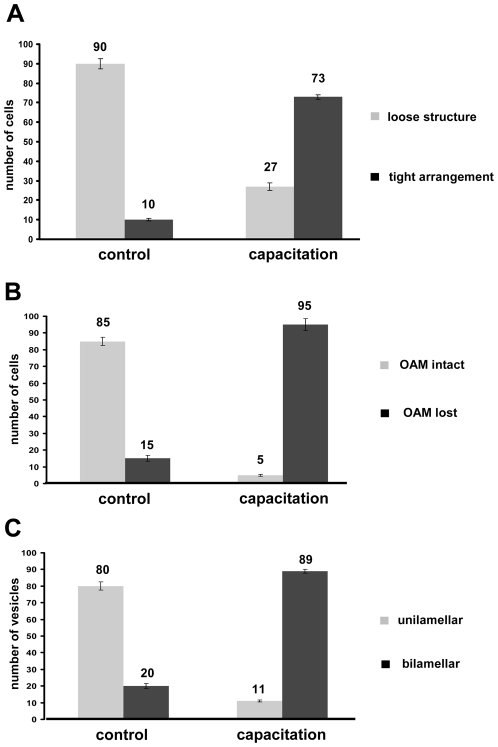
Figure 3. Quantification of PM and OAM arrangements of control and capacitated sperm and their corresponding cavitate fractions.
(A) Quantification of the loose (gray) and tight (black) interacting PM and OAM (for morphologies see Fig. 1B and D respectively). (B) Quantification of intact OAM (gray) and removed OAM in the 1000 g cavitate (for morphologies see Figure 2A and C respectively). (C) Quantification of monolamellar (gray) and bilamellar (black) membrane structures in the 285000 g cavitate. For each experimental condition three independent sections were counted. Individual scores are provided (see Table S1 A–C) (n = 3 values are indicated ± SD for all the data presented the differences between capacitation and control conditions were significant; P<0.0001).

