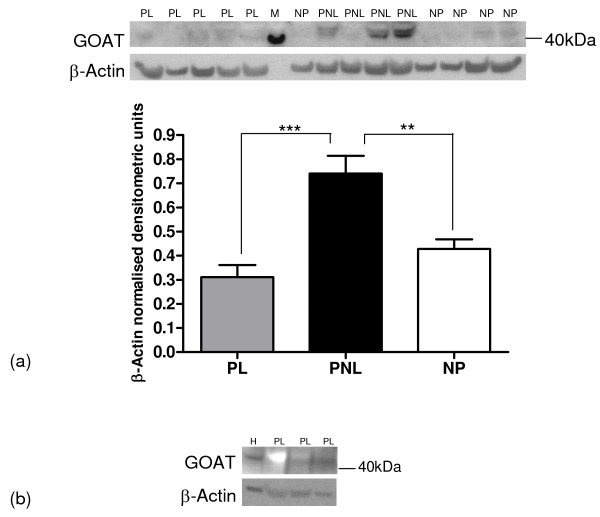
Figure 5.
Representative Western blots of GOAT protein expression in human myometrium. (a) PL (n = 5), PNL (n = 4), NP (n = 5), (b) HeLa cells (H) (n = 1) and myometrial PL (n = 3). The corresponding ACTB western blots are presented underneath each western blot. Molecular weights (M) are indicated in kDa. Quantitative densitometric analysis of each protein band indicated a(i-iii) is presented, with β-Actin-normalised densitometric units for GOAT plotted against pregnancy state ± SEM (indicated with error bars). ** indicates a significance value of P < 0.01, *** indicates a significance value of P < 0.001.

