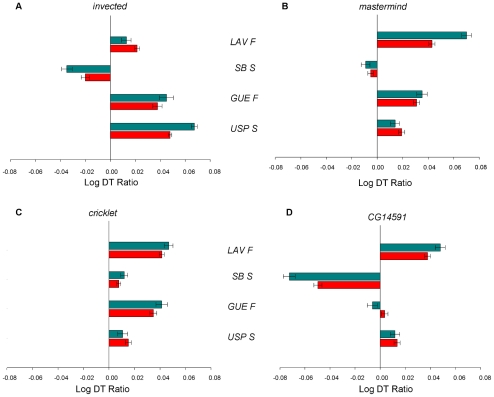
Figure 5. Quantitative complementation tests.
Developmental time ratios for each line over a heterochronic mutant allele relative to that line over a Canton S B allele. The heterogeneity in the magnitude and direction of the DT ratios represents the genetic variation for each heterochronic gene. A) invected. B) mastermind. C) cricklet. D) CG1491. Blue bars represent larval developmental time and red bars refer to egg-to-adult developmental time.

