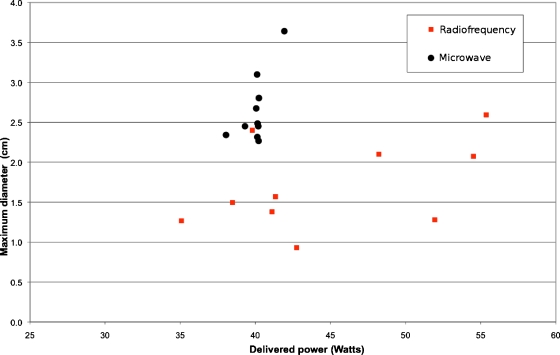
Figure 4.
Graph shows the relationship between delivered power and ablation size (maximum diameter) in ex vivo porcine lungs. Microwave ablations (●) have a greater maximum diameter than radiofrequency ablations (◼) (mean difference 0.96 cm, p<0.0001) even though the mean power delivered was slightly lower.

