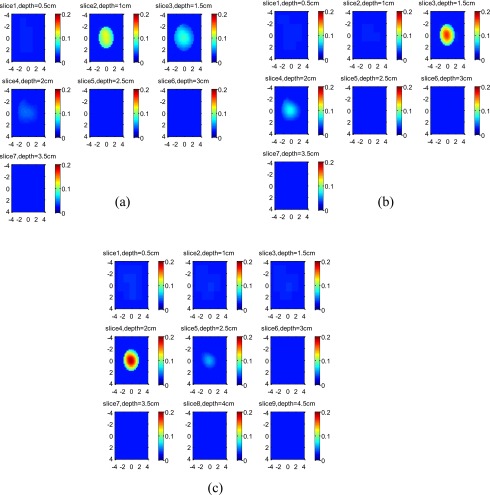
Figure 7.
Experimental results of 3-cm-diam high-contrast target. The target center was located at (a) 2.0 cm, (b) 2.5 cm, and (c) 3.0 cm, respectively. Each slice is the tomographic display of reconstructed absorption distribution in 8 cm×8 cm spatial x-y dimensions. The depth of each slice is marked in the figure.

