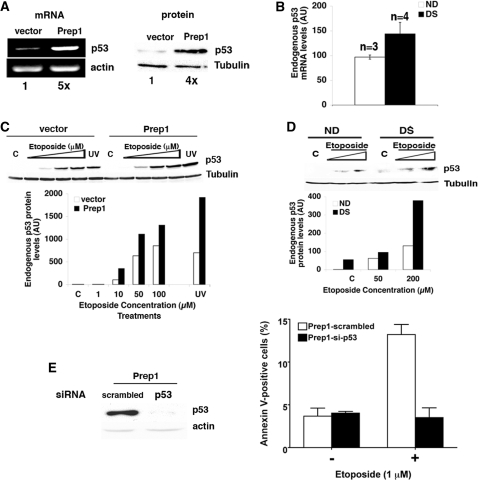
Figure 4.
Endogenous p53 expression levels increase in Prep1 overexpressing cells and its depletion rescues the apoptotic phenotype. (A; left) Total RNA was purified from untreated Prep1-overexpressing or control F9 cells, retrotranscribed using polyA+ primers and semiquantitative PCR analysis performed using specific primers for murine p53 and β-actin. Densitometric analysis results are shown under each lane. (Right) Crude extracts from the above cells were fractionated by 12% SDS-PAGE and transferred to PVDF membrane. Endogenous p53 levels were analyzed by immunoblotting with a specific monoclonal antibody. Tubulin was used for normalization. Densitometric analysis results are shown under each lane. (B) Total mRNA form ND (n = 3) and DS (n = 4) fibroblast lines was purified and processed as above. Quantitative real-time PCR was performed using primers specific for human p53 and the data are normalized to β-actin mRNA values. (C) Prep1-overexpressing or control F9 cells were treated with etoposide as shown or irradiated with UV C (254 nm; 60 J/m2). After 12 h of treatment or 12 h post-irradiation, crude extracts were prepared, resolved by 12% SDS-PAGE and transferred in PVDF membrane. The amount of p53 protein was determined by immunoblotting using a specific monoclonal antibody and the value normalized to tubulin. The graph reports the representative results of the above immunoblot (from one of three independent experiments), which was exposed for a short time to maintain p53 in the linear range for most of the lanes and in which p53 is not visible either in the C or 1-µM lanes. However, a longer exposure of the same blot shows the presence of p53 in the relevant C and 1-µM lanes (Supplementary Figure S1C). (D) Crude extracts were prepared from ND and DS fibroblasts treated (or not) with etoposide for 24 h, as indicated, fractionated and transferred as above. The levels of p53 were determined by densitometric analysis of the immunoblot, performed using specific monoclonal antibody and normalized to tubulin. C, untreated cells. The representative results of one of three independent experiments (using different ND and DS fibroblast lines) are shown. (E; left) Prep1 overexpressing F9 cells were infected with p-retro-super vector containing either a p53-specific or scrambled sequence shRNA and the level of endogenous p53 protein was detected from an aliquot of cells by immunoblotting using a monoclonal antibody and quantitated by densitometry and normalized to β-actin content. (Right) Another aliquot of knocked down or control Prep1-overexpressing F9 cells was treated with etoposide (1 µM) for 24 h and apoptotic cells were detected by flow cytometry using Annexin-V staining and their number plotted. The values were expressed as percentage of total events.

