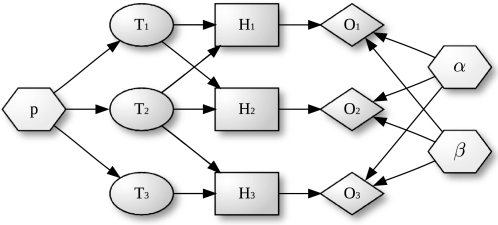
Figure 1.
A Bayesian network to model gene response with gene categories. Gene categories, or terms ( , ellipses) can be either on or off. Terms that are on activate the hidden state (
 , rectangles) of all genes annotated to them, the other genes remain off. The observed states (
 , diamonds) of the genes are noisy observations of their true hidden state. The parameters of the model (light gray nodes) are the prior probability of each term to be active,
  , the false positive rate,
  and the false negative rate,
  .
.

