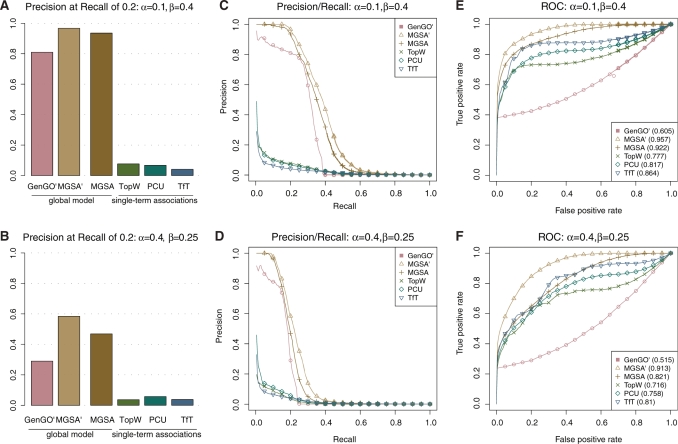
Figure 2.
Benchmarking on simulated data set. Performance of the TfT, PCU, TopW, GenGO , MGSA
 and MGSA algorithms on simulated data set with different settings of false positive (
 ) and false negative (
 ) rates. In each row, the leftmost panel shows the precision for a recall of 0.2 (A, B), the middle panel precision as a function of recall (C, D) and the rightmost panel the ROC curve (E, F).

