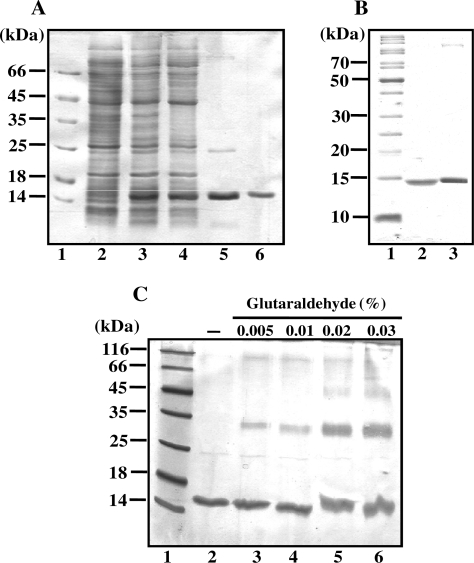
Figure 2.
(A) SDS–PAGE analysis showing induced expression of M. tuberculosis H-NS and at various stages during its purification. Ten micrograms of proteins from the indicated sample was resolved on SDS–PAGE and visualized by staining with Coomassie blue. Lanes: 1, SDS–PAGE standards molecular mass markers; 2, uninduced cell-free lysate; 3, induced cell-free lysate; 4, (NH4)2SO4 precipitate; 5, chromatography on dsDNA cellulose; 6, chromatopraphy on Superdex S-75. (B) Side-by-side comparison of M. tuberculosis and E. coli H-NS proteins by SDS–PAGE. Lanes: 1, SDS–PAGE standards molecular mass markers; 2, E. coli H-NS (1 µg); 3, M. tuberculosis H-NS (1 µg). (C) Glutaraldehyde crosslinking of M. tuberculosis H-NS. The reactions were performed as described under ‘Experimental Procedures’ section. Lane 1, molecular weight standards; 2, H-NS incubated in the absence of glutaraldehyde; 3-6, H-NS incubated with concentrations of glutaraldehyde as indicated at the top of the gel image.

