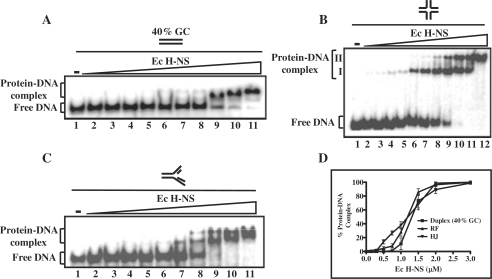
Figure 6.
Binding of E. coli H-NS to the HJ and to other DNA substrates. Reactions were performed with 1 nM of 32P-labeled DNA (duplex DNA having 40% GC content or replication fork) in the absence (lane 1) or presence of 0.1, 0.15, 0.25, 0.3, 0.5, 0.75, 1, 1.5, 2 and 3 µM E. coli H-NS (lanes 2–11), respectively. Similarly, 1 nM of 32P-labeled HJ was incubated in the absence (lane 1) or in the presence of 0.1, 0.15, 0.25, 0.3, 0.5, 0.75, 1, 1.5, 2, 2.5 and 3 µM E. coli H-NS (lanes 2–12), respectively. Reaction products were separated and visualized as described under ‘Experimental Procedures’ section. The open triangle on the top of the gel image denotes increasing concentrations of E. coli H-NS. (A) Linear duplex DNA; (B) HJ; (C) replication fork. The positions of free DNA and protein–DNA complexes are indicated on the left-hand side of the gel. (D) Graphical representation of E. coli H-NS binding to different DNA substrates. The extent of protein–DNA complexes in (A–C) is plotted versus varying protein concentrations. Standard deviations are derived from three independent experiments.

