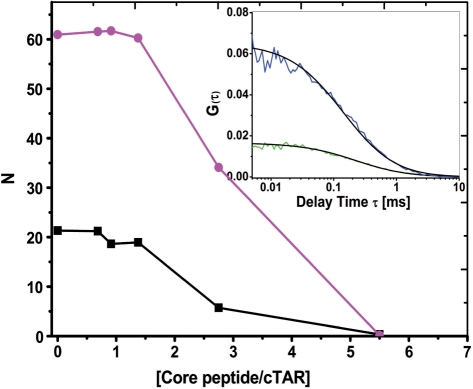
Figure 1.
Evidence by fluorescence correlation spectroscopy of core peptide-induced aggregation of TMR-5′-cTAR. The average number of fluorescent species, N, for 100 nM (black squares) or 300 nM (magenta circles) of TMR-5′-cTAR within the excitation volume was obtained by fitting the autocorrelation curves to Equation (1). The curves are given with peptide E. Data with peptide F and D1 domain were very similar and were thus not represented. (Inset) Autocorrelation curves of 100 nM (blue line) and 300 nM TMR-5′-cTAR (green line) and their fits (black line) with Equation (1) in the presence of 140 nM and 420 nM of peptide E, respectively.

