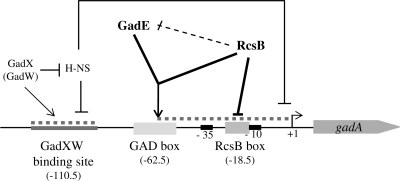
Figure 7.
Regulatory model of gadA transcription. Schematic representation of gadA regulatory region with the GadXW (33), GAD and RcsB boxes (gray boxes). The H-NS binding sites responsible for gadA repression are represented as dotted line (37). Direct regulation is shown as a continuous arrow. Repression of gadE transcription by RcsB, in which a direct effect has not been confirmed, is shown as a dotted arrow. This putative feed-forward loop could coordinate gadA expression.

