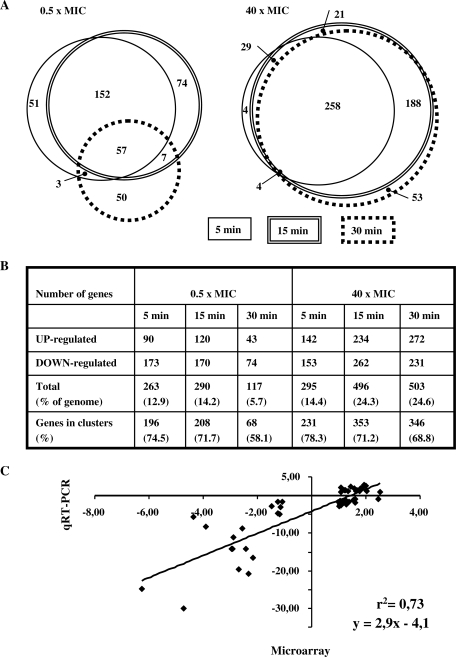
Figure 4.
Gene expression analysis and validation of microarray data by qRT–PCR. (A) Venn diagram with three circles, each one corresponding to one time interval in each condition, showing the differentially expressed genes in six conditions. The area is proportional to the number of genes. A complete list of the genes can be found in Supplementary Table S1. (B) Classification of the responsive genes in the six conditions. (C) Correlation of the changes in RNA transcript levels using data from microarray hybridizations and qRT–PCR. Values can be found in Supplemental Table S2.

