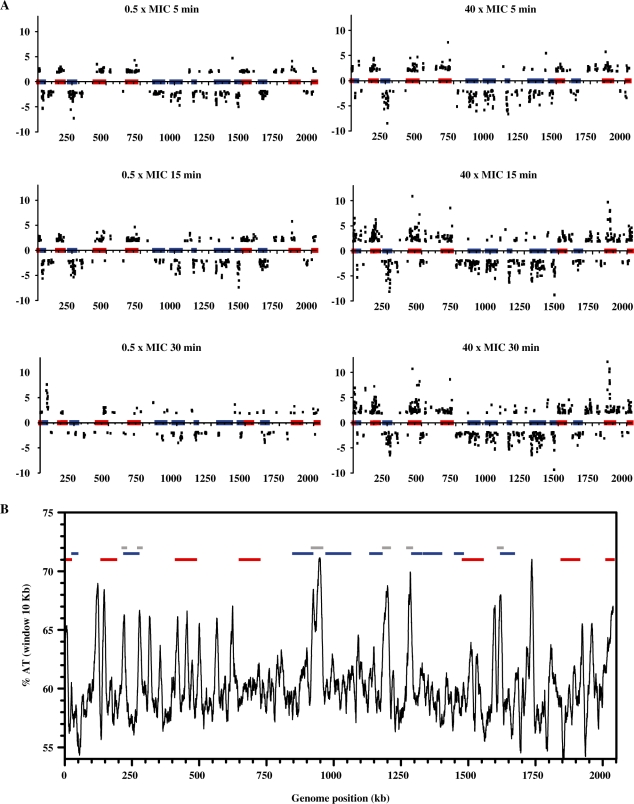
Figure 5.
Localization of relaxation responsive genes in the S. pneumoniae chromosome. (A) Cultures were grown as described in Figure 1 and treated with different Nov concentrations. Samples were taken before the addition of the drug (time 0 min), and at indicated times, total RNA was isolated, double-stranded cDNA was synthesized, labelled with Cy3 and hybridized on high-density arrays. The relative fold variation of each gene is represented against the 3′ location of each open reading frame in the S. pneumoniae R6 chromosome (bases 1 to 2 038 615). Boxes indicate the transcriptional clusters: up-regulated in red, down-regulated in blue. (B) Analysis of percentage of AT content calculated at intervals of 100 bp along the whole R6 genome applying a window of 10 kb. Boxes indicate transcriptional clusters defined in (A). Flanking regions are shown in grey.

