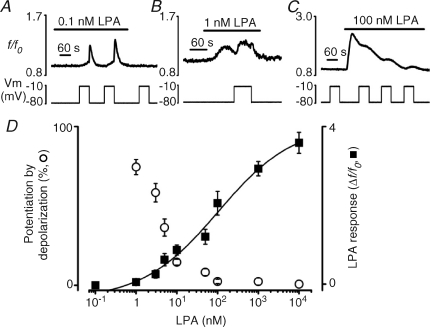
Figure 3. Potentiation of LPA receptor-evoked Ca2+ response by depolarization is greatest at low concentrations of LPA.
A–C, effect of a depolarizing pulse (−80 to −10 mV) on [Ca2+]i at a subthreshold (0.1 nm, A), near-threshold (1 nm, B) and suprathreshold (100 nm, C) concentration of LPA in Ca2+-free external solution. At 0.1 nm LPA (A), all oocytes failed to respond to the agonist alone, whereas 3 out of 8 cells displayed a subsequent depolarization-evoked [Ca2+]i increase. D, semilogarithmic concentration–response relationship for the depolarization-evoked [Ca2+]i increase (open circles, measured as a percentage of the corresponding LPA-evoked response) and LPA-evoked peak response (Δf/f0, filled squares), versus the LPA concentration. Potentiation by depolarization at 0.1 nm LPA is excluded due to lack of agonist response. LPA-evoked peak response data were best fitted with the logistic equation:  , where x0 is the middle value, p is the power and A1 and A2 are the initial and final Y values, respectively. Each point is the mean and s.e.m. of 4–13 cells.

