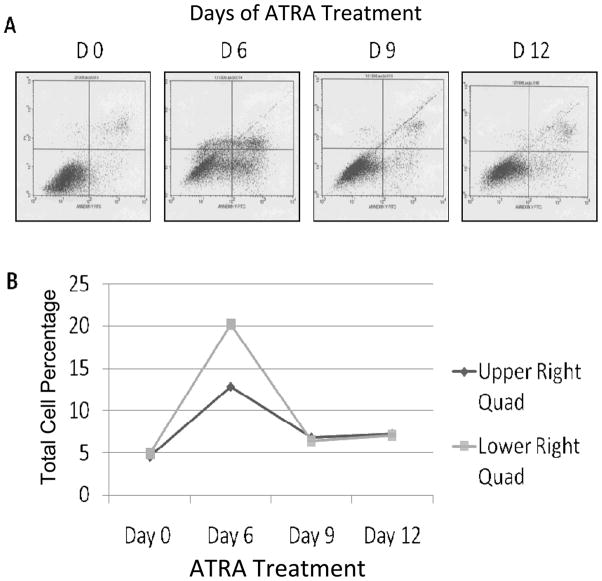
Figure 4.
Effect of ATRA on cellular apoptosis measured by FACS. (A) The lower left quadrant represents live cells, the upper and lower right quadrants represent late and early apoptotic cells respectively and the upper left quadrant indicates dead (necrotic) cells. (B) Graphical representation of cell numbers in the early and late apoptotic quadrants.

