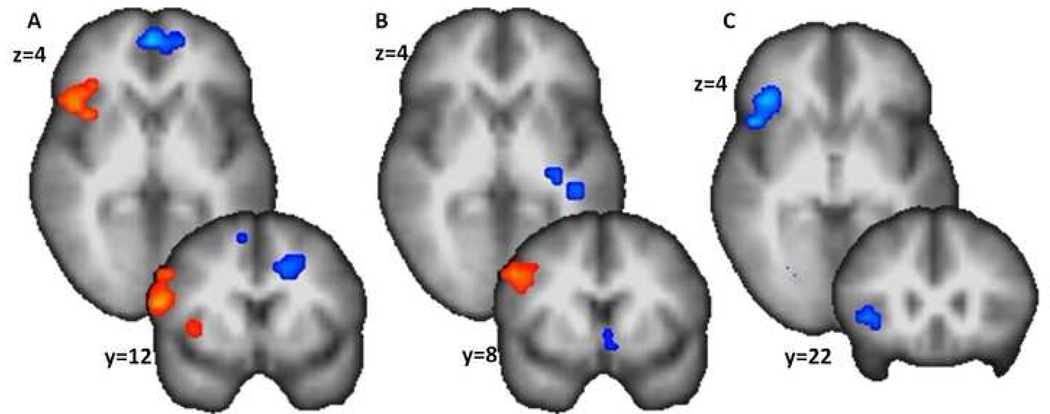
Figure 2.
Anticipatory switching in NTC (A), IPV-PTSD (B), and IPV-PTSD v. NTC (C). Both groups show DLPFC activations (in red) as visible in the coronal slices (i.e., y=..). However, only the NTC group shows anterior insula activation (as seen in the axial or × slice). This region showed a significantly greater activation for the NTC group than for the IPV-PTSD group (in blue) as depicted in the axial and coronal slices (C).

