
Figure 4. Core c-Fos expression model.
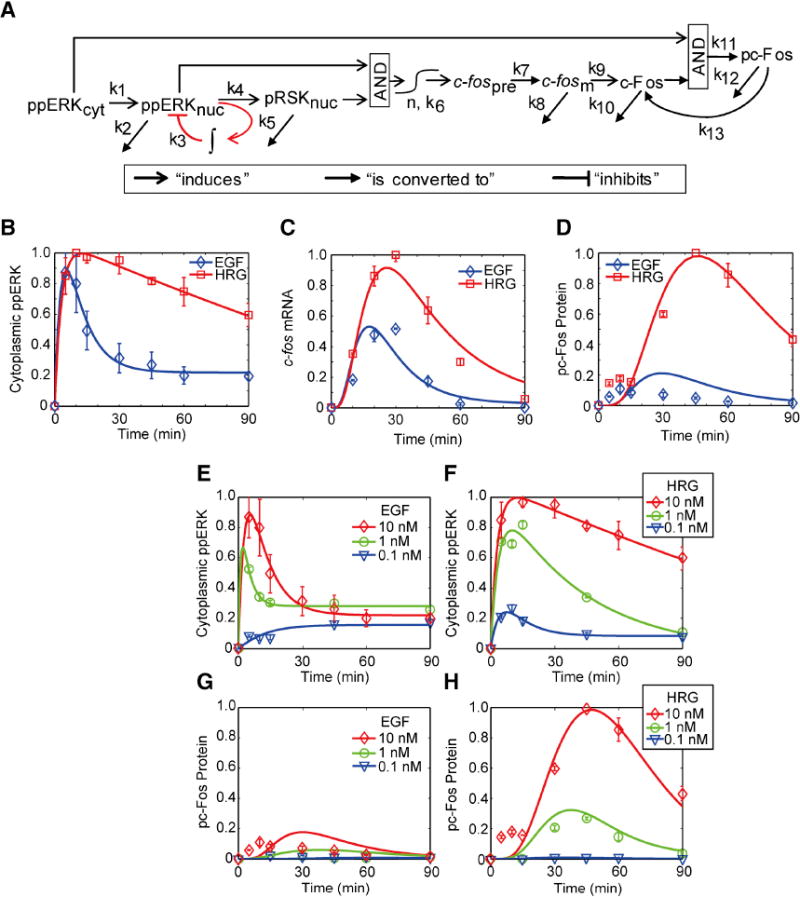
A. Model schematic. B-D The core model parameters were trained by the responses of ppERK, c-fos mRNA, and pc-Fos to 10 nM EGF or 10 nM HRG in MCF-7 cells. E-H. To validate the model, we compared model predictions to the observed pc-Fos responses for different EGF and HRG doses (1 nM and 0.1 nM) in MCF-7 cells. Experimental data were obtained with western blotting (proteins) or qRT-PCR (mRNA). Error bars denote standard error for at least three independent experiments, and representative western blot images can be found in Fig. S3. For all time course plots, solid lines denote simulations. See also Fig. S3.