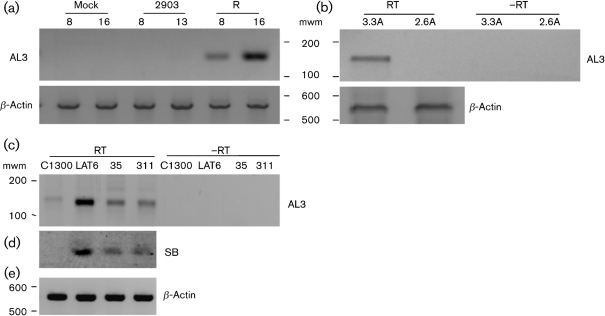
Fig. 2.
Analysis of AL3 transcription in cultured cells. (a) RS cells were infected with dLAT2903 (2903 lanes) or dLAT2903R rescued virus (R lanes) (m.o.i.=1). Cells were lysed at 8 or 16 h after infection and total RNA was prepared. DNase I-treated RNA samples (1 μg) were used to synthesize single-stranded cDNA using the AL3-specific primer K (see Fig. 1c and Supplementary Table S1 for position and sequence of K). PCR was performed using K as reverse primer and C as forward primer. (b) RS cells were infected with the LAT2.6A or LAT3.3A recombinant virus (m.o.i.=2). Total RNA was prepared 16 h after infection and RT-PCR was performed as in (a). −RT, Reverse transcriptase was not included in the reaction. (c, d) The indicated cells were lysed and total RNA was prepared. RT-PCR and PCR were performed as in (a). To confirm PCR results (c), a Southern blot was performed using internal Probe M (d). (e) β-Actin RT-PCR was used as a loading control for (a–d). Molecular mass markers (mwm) are from a 100 bp ladder (Invitrogen). Images of autoradiographs were scanned using a CanoScan 8600 F and the scanned image was saved as a JPEG file. Images were prepared from gels using a Molecular Imager FX (Bio-Rad) and these images were saved as JPEG files. The brightness of the respective images was adjusted to match the other panels.

