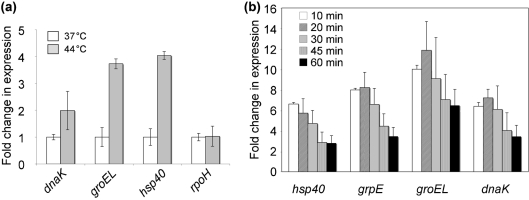
Fig. 2.
Quantification by RT-PCR of transcript levels of selected genes after heat shock. (a) Validation of microarray experiment. Transcript levels were normalized to that of DNA helicase (FTL_1656) and the fold difference (relative to 37 °C) and sds are shown for the dnaK, groEL, hsp40 and rpoH genes. (b) Change in expression of four heat-shock genes during 60 min incubation at 44 °C. Transcript levels were normalized to that of DNA helicase (FTL_1656) and the fold difference (relative to sample taken before temperature shift) and sds are shown for the dnaK, groEL, hsp40 and grpE genes. Data are from triplicate samples.

