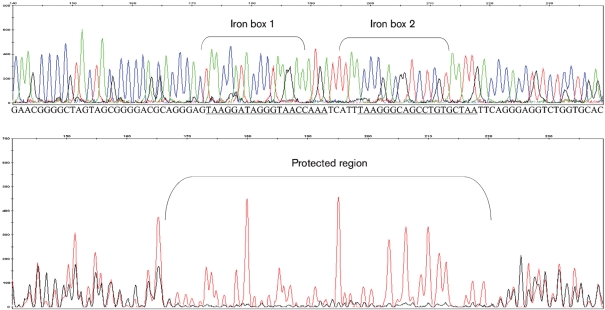
Fig. 2.
DNase footprint assay showing the binding of the MAP2827 protein to the iron box sequence located on the MAP mbtB promoter. Red peaks in the electropherogram represent DNA alone and black peaks represent DNA pre-incubated with MAP2827 (bottom panel). Both reactions were partially digested with DNase I and analysed by capillary electrophoresis in a genetic analyser (Applied Biosystems 3130xl). The top panel shows an electropherogram of the promoter sequence with the terminal bases identified (iron box sequence is underlined). The protected region is indicated which overlaps the iron box sequence. Note the difference in the heights of black peaks (lost completely) relative to red peaks, indicating protection from DNase digestion.

