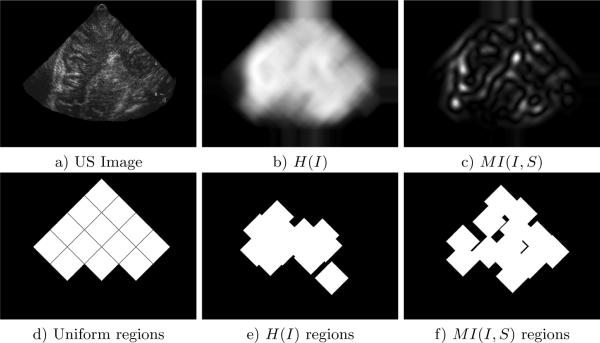
Fig. 4.
a) is a US image, images b) and c) are entropy and MI region selection criteria evaluated at all pixel locations in image a). Images d)–f) illustrate the three region sampling/selection strategies applied to the US image. For each strategy, 13 diamond-shaped regions of size 39 × 39 are chosen in the US image. Region size is determined empirically, smaller regions tend to result in spurious matching and larger regions tend to be poorly localized. 13 regions are used to uniformly sample the US image in c), and automatic selection identifies the 13 image regions with the highest value of the particular criterion in d) and e). A minimum distance of 20 pixels is enforced between automatically selected regions to ensure even distribution throughout the image.

