
Figure 16.
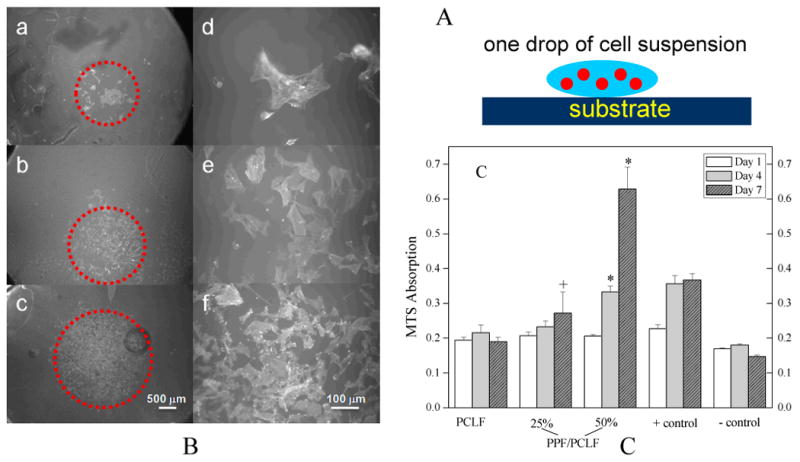
A: Schematic SPL201 cell seeding on the crosslinked polymer discs. B: Morphology (a, b, c: ×25; d, e, f: ×200) of SPL201 cells on the crosslinked discs 7 days after seeding. (a) PCLF, (b) PPF/PCLF (25%), (c) PPF/PCLF (50%), and (d) tissue culture polystyrene (TCPS). The scale bar of 500 μm in (c) is applicable to (a-c) and 100 μm in (f) is applicable to (d-f). C: MTS absorption of SPL201 cells on the crosslinked discs of PCLF, PPF/PCLF (25%) and (50%) compared to cell-seeded TCPS as positive (+) control and empty TCPS as negative (-) control. * p<0.05 between PPF/PCLF (50%) and PCLF, PPF/PCLF (25%), or negative (-) control. + p<0.05 between PPF/PCLF (25%) and PCLF at day 7.