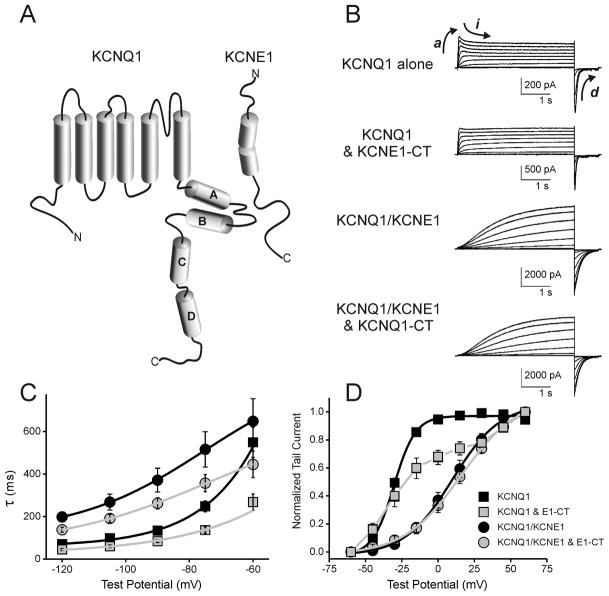
Figure 2. Functional interaction of free-KCNE1-CT with KCNQ1 channels.
(A) Schematic Diagram of KCNQ1 and KCNE1 channel subunits with cylinders representing predicted α-helices. (B) Voltage clamp current traces (elicited by depolarizing voltage steps) of KCNQ1 alone, KCNQ1/KCNE1-CT, KCNQ1/KCNE1 and KCNQ1/KCNE1/KCNE1-CT channels expressed in CHO cells. (C) Deactivation rates plotted against voltage from CHO cells expressing KCNQ1 either without KCNE1, or with KCNE1, KCNE1-CT, or with both KCNE1 and KCNE1-CT. (D) Normalized voltage-dependence of activation curves from same cells as in panel C.

