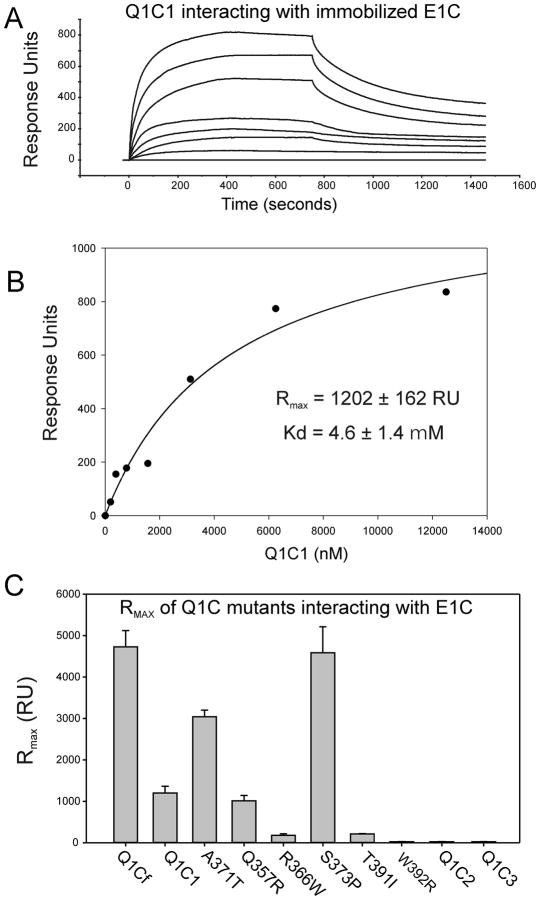
Figure 6.
Surface plasmon resonance analysis of the interactions of KCNQ1 C-terminal cytoplasmic domains with KCNE1 C-Terminus. SPR analysis was carried out as described in Materials and Methods. (A) Illustrates a typical sensorgram for the interaction of various concentrations of the Q1C1 fragment of KCNQ1 with E1C immobilized on a CI sensor chip. Each trace represents the response to increasing concentrations of Q1C1. Introduction of each concentration of Q1C1 is started at time=0 and washout at 750 seconds. (The concentration ranges used were 0.5–10 μM for KCNQ1 C-terminal fragments.) (B) A typical plot of sensorgram data is show for a Q1C1-E1C interaction experiment. The data were fitted separately for each experiment to the two-state binding model where A + B ↔ AB* ↔ AB, as described in the Methods section. (C) The graph shows maximum response values (RUmax) for the highest concentration (10μM) of various KCNQ1-C-terminal fragments and LQT1 mutants. These data were used to derive Kd calculations shown in Table 1.

