Figure 1.

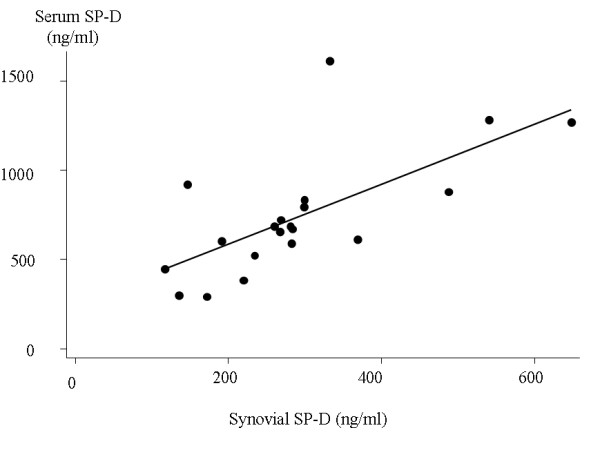
Scatter plot of SP-D in serum and synovial fluid at baseline (n = 20). Fitted values are depicted by the line. SP-D, surfactant protein D.

Scatter plot of SP-D in serum and synovial fluid at baseline (n = 20). Fitted values are depicted by the line. SP-D, surfactant protein D.