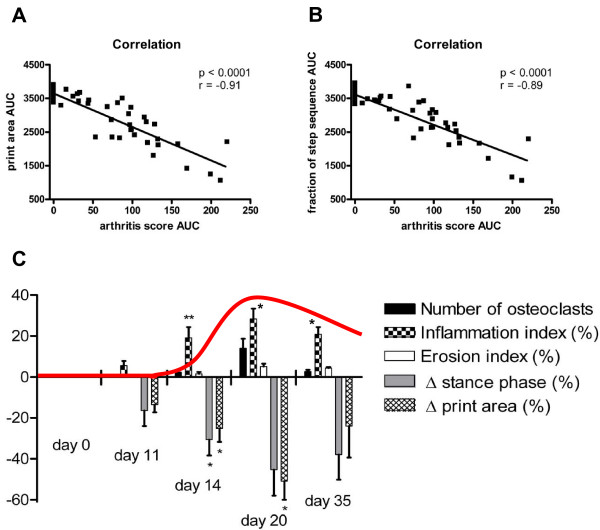
Figure 4.
Clinical variables and histopathological changes of PIA correlate with gait changes measured by CatWalk. X-Y scatter plots of correlations between arthritis score AUC and print area AUC (A) and stance-phase fraction of total step duration AUC (B) of individual paws (n = 80) from pristane-injected and control animals are shown. Pearson coefficients (r) and P-values are depicted within the graph. (C) Rats were monitored by CatWalk and sacrificed at characteristic time points (Day 0 = naïve animals, Day 11 = preclinical phase, Day 14 = onset, Day 20 = highest severity, Day 35 = begin of remission). The areas of inflammation, erosion, and the numbers of osteoclasts were determined histomorphometrically and adjusted to the total area of tissue analysed. The course of clinically apparent PIA is shown as an overlay in red. Each bar represents mean ± SEM from three arthritic paws.

