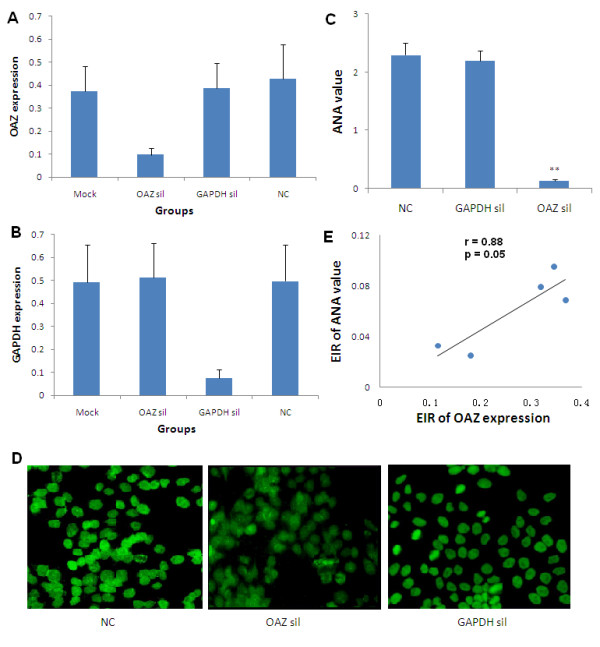
Figure 2.

Blockade of ANA production after OAZ silencing in vitro. a. OAZ expression decreased after the silence of OAZ. The highest expression level was set to be 1 (100%) and expression data in Mock group (mock), OAZ silence group (OAZ sil), GAPDH silence group (GAPDH sil) and negative control group (NC) were shown as mean values ± SEM. A significant decline of mRNA expression was found in the OAZ silence group comparing to that in the negative control group (P < 0.05). b. GAPDH expression dramatically decreased after the silence of GAPDH. Values were shown as mean ± SEM. A significant decline of mRNA expression was found in the GAPDH silence group comparing to that in the negative control group (P < 0.05). c. Decreased ANA level after OAZ silencing. ELISA was preformed to measure the production of ANA and data were shown as mean OD values ± SEM. A dramatically decline of ANA production was found in the OAZ silence group as compared to negative control group and GAPDH silence group (** P < 0.01). d. Decreased intensity of ANA fluorescence after OAZ silencing. Representative photomicrographs of ANA fluorescence in negative control group, OAZ silence group and GAPDH silence group were shown. After OAZ silence, only weak fluorescence was observed. e. Association of OAZ expression and ANA level. The excitation-inhibition ratio (EIR) of OAZ expression was positively correlated with EIR of ANA value after gene silencing (Pearson r = 0.88, P = 0.05).
