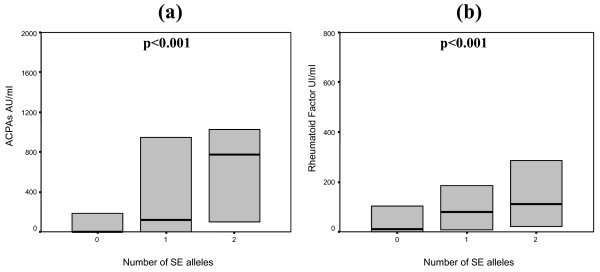
Figure 1.
Box plots of anti-citrullinated protein antibody (ACPA) levels (a) and rheumatoid factor (b) in rheumatoid arthritis patients depending on the number of shared epitope (SE) alleles. ACPA levels are expressed as arbitrary units per milliliter (AU/mL), and rheumatoid factor levels are expressed as international units per milliliter (UI/mL). Each box represents the 25th to 75th percentiles. Lines outside the boxes represent the 10th and 90th percentiles, and lines inside the boxes represent medians. Differences in values between groups were analyzed using the Kruskal-Wallis test for non-parametric data.

