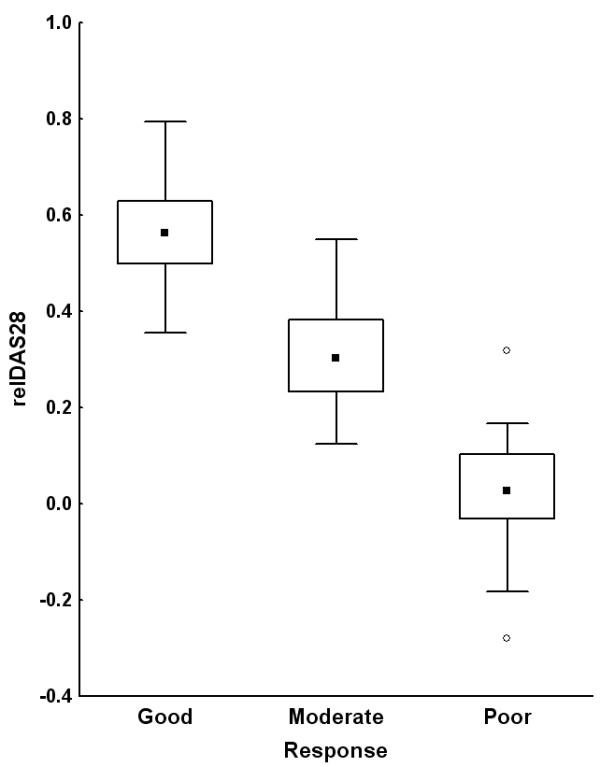
Figure 1.

Good correlation between outcome variables: EULAR (European League Against Rheumatism) response classification and relDAS28. Medians, interquartile ranges, and non-outlier ranges are represented as dots, boxes, and whiskers, respectively. Empty dots represent outliers. relDAS28, relative change in disease activity score using 28 joint counts between baseline and time of evaluation.
