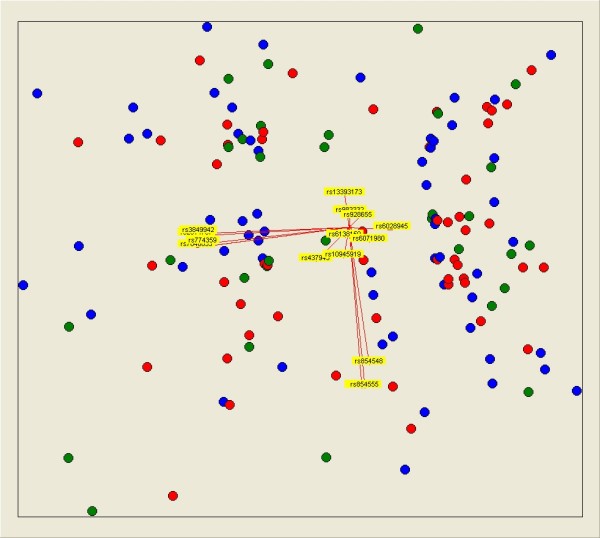
Figure 2.

Multivariate visual analysis showing that 16 single-nucleotide polymorphisms were not able to separate rheumatoid arthritis patients classified according to their EULAR (European League Against Rheumatism) response. Responders are represented as blue dots, moderate responders as red dots, and non-responders as green dots. Yellow arrows represent the genotypes of each of the 16 single-nucleotide polymorphisms according to an additive model. This representation was obtained with Visual Co-Plot.
