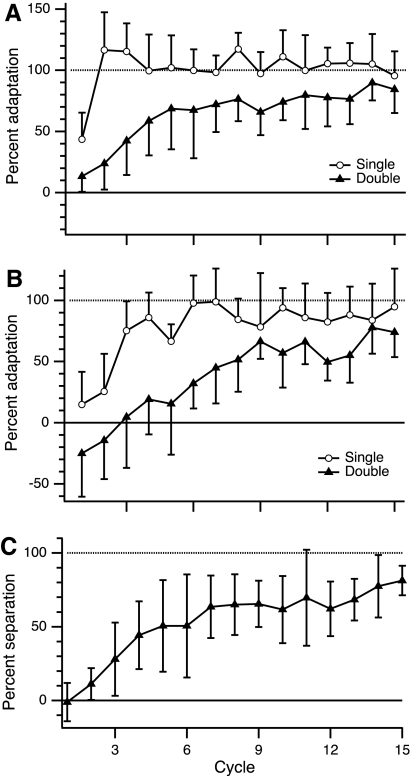
Fig. 4.
Progression of adaptation in training (TRN) condition of experiment 1. A: percent adaptation to imposed gain Gi = 1.5 is plotted against training cycle (group mean ± SD; 1 cycle = 4 trials). B: percent adaptation to imposed gain Gi = 0.8. C: percent separation in double-gain condition, i.e., ratio of difference between observed gains in training directions and difference between values of Gi (1.5, 0.8) in double-gain condition, ×100%. In all panels: open circles, single-gain condition; filled triangles, double-gain condition. Note that cycles in A and B are not composed of consecutive movements, but instead indicate 4 movements with a specific gain, 0.8 or 1.5.

