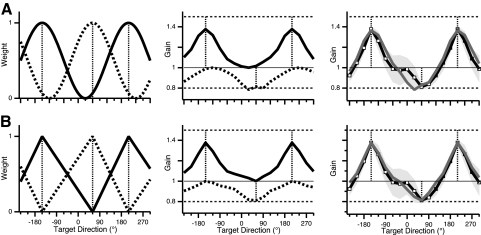
Fig. 8.
Weighted combination models hypothesized to account for the double-gain GP observed in experiment 1. Gain (predicted or observed) is plotted against standardized target direction in double-gain condition with imposed gain values 1.5 (−150°) and 0.8 (60°). Vertical dashed lines, training directions. A: independent spatial weighting model. Left: cosine weighting functions, ranging from 0 to 1, with peaks at respective training directions for each gain. Solid trace, gain 1.5; dotted trace, gain 0.8. Middle: weighted versions of single-gain GPs, obtained by multiplying single-gain GPs (traces in Fig. 5, A and B) by the weighting functions (left), after transforming single-gain GPs to deviations from baseline gain of 1. Right: double-gain GP predicted by model (gray) and observed (black). B: relative spatial weighting model. Left: linear weighting functions, ranging from 1 at the training direction for a given gain to 0 at the training direction for the other gain. Slope of each segment is determined by angular separation between training directions. Middle: weighted versions of single-gain GPs, obtained by multiplying single-gain GPs by the weighting functions. Right: double-gain GP predicted by model (gray) and observed (black).

