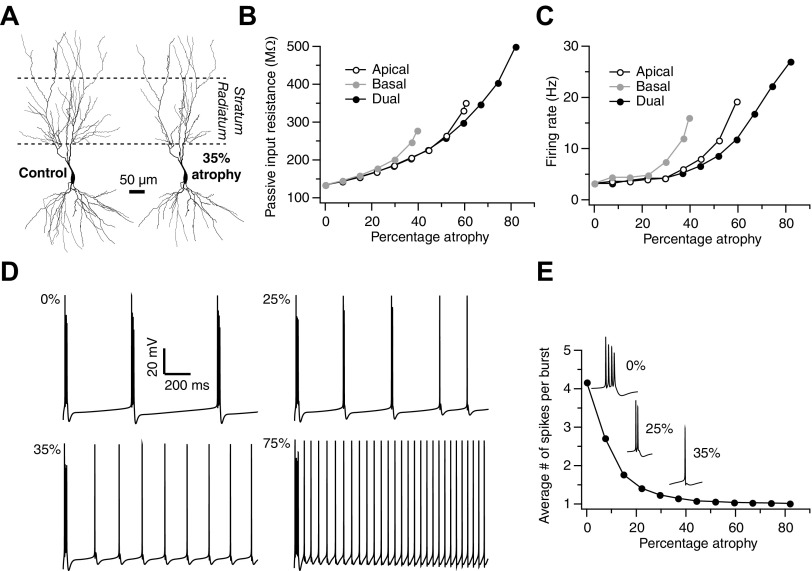
Fig. 1.
Atrophy alters electrophysiological properties of CA3 pyramidal cells. A: example of dendritic atrophy (35% atrophy, right), induced by the pruning algorithm, in which a typical Control (left) neuron from the Duke Southampton archive is subjected to 35% reduction in dendritic length (13,669 to 8,642 μm) and 23% reduction in number of branch points (63 to 48). In conformity with experimental results, maximal atrophy may be observed in the stratum radiatum region (delineated by dotted lines; 100–350 μm from the soma) and in the mid-basal regions. B: passive input resistance as a function of the percentage of atrophy (percentage atrophy is calculated, in all cases, with respect to the total dendritic length of the Control neuron) of either apical (black open circles) or basal (gray) dendrites alone or both together (black closed circles). C: action potential firing rates of CA3 pyramidal cells as a function of percentage of atrophy. Notations as in B. D: a transition in action potential firing patterns, from burst firing to regular spiking, exhibited by a control neuron (0% pruning) and neurons with varying degrees of pruning (35, 45, 75%). E: average number of spikes per burst, computed over a period of 5 s of current injection, as a function of percentage of atrophy. Insets depict single bursts, which are magnified versions of corresponding plots in D, generated by neurons that underwent 35 or 45% or no atrophy (0%).

