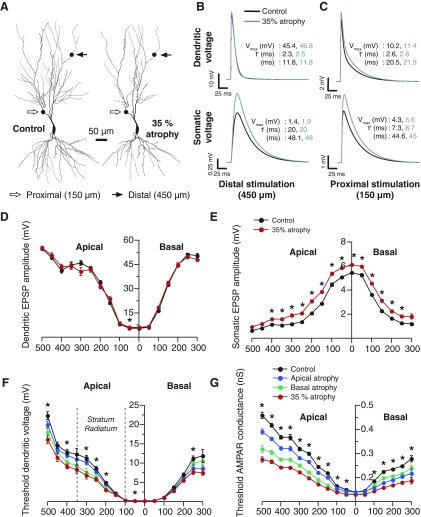
Fig. 2.
Region-specific atrophy induces region-specific increase in synaptic excitability in a passive dendritic tree. A: reconstructions showing a Control neuron and the same neuron after 35% atrophy imposed by the pruning algorithm. Synaptic locations of distal and proximal stimulation sites, used in B and C, are indicated. As the dendritic tree with 35% atrophy is obtained from the Control tree, it may be considered as a subtree with both distal and proximal locations corresponding to the same dendritic compartments as in its Control counterpart. B: excitatory postsynaptic potentials (EPSP) evoked by the injection of a single AMPA-excitatory postsynaptic current (EPSC), at a distal location (450 μm from the soma) on a passive dendrite, as measured at the site of injection (top, Dendritic Voltage) or the soma (bottom, Somatic Voltage). C: similar to B, with synaptic stimulation delivered at a more proximal dendritic site (150 μm from the soma). For B and C, Vmax corresponds to the maximum value of voltage attained, tr is the time taken to rise from 0 mV to Vmax, and τ is the decay time-constant obtained by fitting an exponential to the decay phase of the trace. D: local dendritic response amplitude to synaptic stimulation [with a 4 nS AMPA receptor (AMPAR) conductance] of various dendritic compartments as a function of radial distance of that compartment from the soma. E: somatic response amplitude to synaptic stimulation (with a 4 nS AMPAR conductance) of various dendritic compartments as a function of radial distance of that dendritic compartment from the soma. A significant increase in excitability across all regions is evident in the atrophied tree compared with the control tree. In D and E, black shows mean and SE for Control neuron, and red shows mean and SE for neuron with 35% atrophy. F: minimum local dendritic voltage required to elicit a 0.2 mV somatic response with synaptic stimulation of various dendritic compartments plotted as a function of radial distance of the dendritic compartment from the soma. G: minimum local dendritic AMPAR conductance required to elicit a 0.2 mV somatic response with synaptic stimulation of various dendritic compartments plotted as a function of radial distance of the dendritic compartment from the soma. In F and G, black shows mean and SE for Control neuron, red shows mean and SE for neuron with 35% atrophy, blue shows mean and SE for neuron with basal-alone pruning, and green shows mean and SE for neuron with apical-alone pruning. In D–F, *P < 0.001, Student's t-test, Control vs. 35% atrophy.

