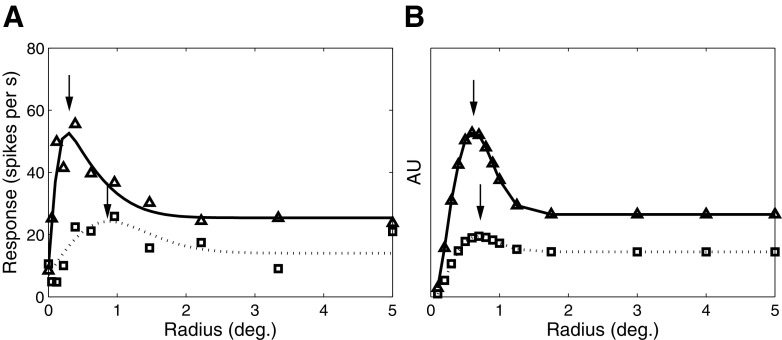
Fig. 7.
Effect of contrast on spatial summation in V1. A: size tuning for a complex cell from layer 4B for high (triangles) and low (squares) contrasts (adapted from Sceniak et al. 1999). B: model end-stopped responses as a function of stimulus size. The solid and dotted traces correspond to the responses elicited by high- and low-contrast drifting gratings. For both the model and real V1 cells, the optimal size (black arrows) increases and the suppression strength decreases as contrast decreases.

