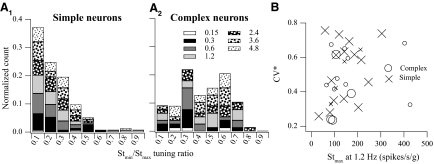
Fig. 10.
A: distribution histogram of the 3D tuning ratio, Stmin/Stmax, in simple (A1) and complex (A2) neurons at various frequencies (see legend). The ordinate lists count fractions normalized with respect to the total number of cases in each class. B: distribution of normalized coefficient of variation (CV*), to t = 15 ms, with respect to the maximum translation sensitivity (Stmax) at 1.2 Hz. Simple (cross) and complex (circle) VOTS neurons that exhibited significant differential responses during 0.3 Hz tilts and translation are emphasized with larger symbols.

