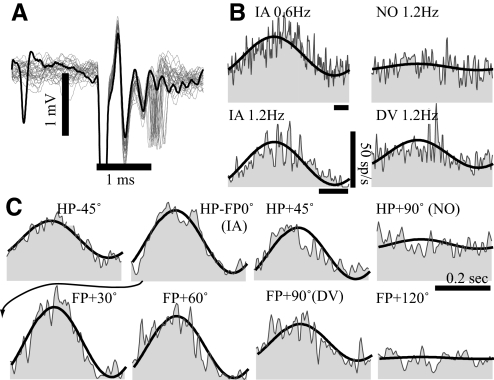
Fig. 3.
A typical simple vestibular-only translation sensitive (VOTS) neuron. A: action potentials (traces) evoked by 0.1 ms, 150 μA of cathodal electrical pulses delivered via a pair of chronically implanted labyrinthine electrodes in the ipsilateral ear. Occasional failure (thick trace) due to the refractory inhibition left the field potential intact. The latency for field potentials and action potentials was 0.7 and 0.9–1.3 ms, respectively. B and C: averaged responses of the same VOTS neuron to 0.6–1.2 Hz, 53–106 cm/s2 translations along the interaural (IA), nasooccipital (NO), and dorsoventral (DV) axes (B) and 2.4 Hz, 210 cm/s2 sinusoidal translations on the horizontal plane (HP) and frontal plane (FP) (C). Neural responses (shaded), aligned in time to the start of positively directed acceleration, are superimposed with the model fits (solid lines) chosen from the frequency dependent spatiotemporal fit. See Fig. 1 for the chosen coordinate frame. Time calibration bars in B and C denote 0.2 s. The arrow indicates the placement of the IA response in the frontal plane series.

