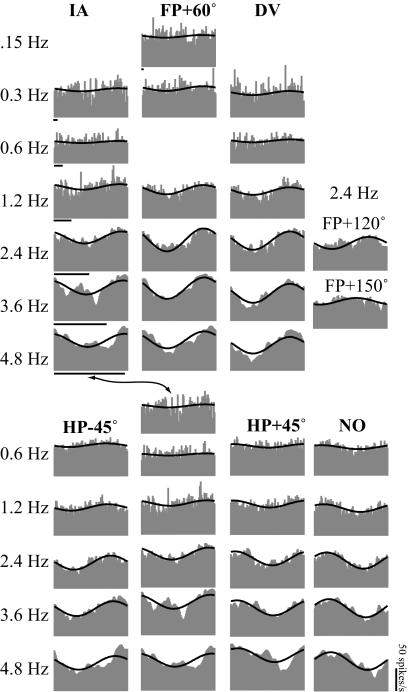
Fig. 5.
Averaged responses of a complex VOTS neuron to 0.15–4.8 Hz, 38–300 cm/s2 sinusoidal translations along IA, NO, and DV axes and along intermediate orientations on the horizontal plane (HP) and frontal plane (FP). Neural responses (shaded), aligned with the acceleration in time, are superimposed with the model fits (solid lines) chosen from the frequency-dependent spatiotemporal fit. Time calibration bars denote 0.2 s. The firing rate calibration bar applies to all graphs. See Fig. 1 for the chosen coordinate frame. Note that IA responses are repeated and presented in both plane series (arrow).

