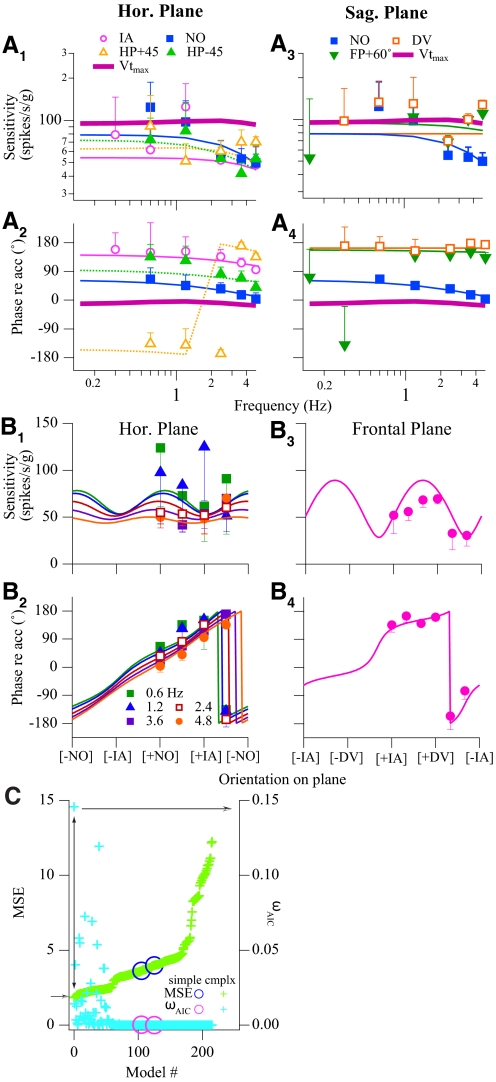
Fig. 6.
Summary of modeling results for the VOTS neuron shown in Fig. 5. The chosen model had the following parameters: Sx = −54.2, τ1-x = 0.023, kx = 0.21; Sy = 78.7, τ1-y = 0.041, ky = −0.35; Sz = −78.7, kz = 0.10. A: Bode plots, i.e., sensitivity and phase vs. frequency, of actual (markers) and modeled (thin solid or dashed lines) responses along the IA, NO, DV, HP +45°, HP −45°, and FP +60° axes. The estimated responses in maximum translation response vectors (Vtmax) are also shown (thick purple lines). B: spatial tuning property of the same VOTS neuron in the horizontal (0.6–4.8 Hz) and frontal (2.4 Hz) planes. Actual (markers) and modeled (lines) responses are plotted against orientation angle on each plane. The selection of this complex model, which accounted for 90% of variance, was deemed necessary, as shown in C. Normalized MSEs (left ordinate) and ωAIC (right ordinate) obtained from all successfully converged models are plotted according to the ascending order of MSE. The complex model that produced a low MSE and high ωAIC (crosses linked by the double arrowheaded line) was chosen (see text). Error bars (SEs) in A and B are shown in one direction and may be obscured by symbols.

