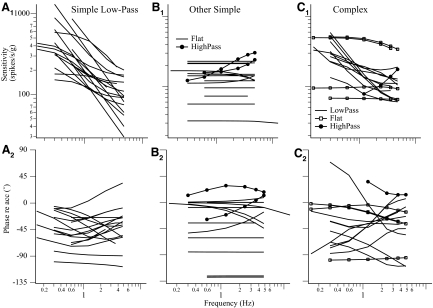
Fig. 7.
Response dynamics of the 47 VOTS neurons along the Vtmax estimated from their respective chosen model based on the frequency-dependent spatiotemporal analysis. The Stmax and ϕtmax of low-pass VOTS simple neurons are plotted in A, whereas those of the flat-gain (line) and high-pass (circles) simple neurons are plotted in B. Likewise, the predicted Stmax and ϕtmax of complex neurons that exhibited low-pass, high-pass, or flat dynamics are plotted in C. Responses were reconstructed at the frequency at which neural recordings were made. Neurons with an averaged sensitivity slope ≤4 or ≥ −4 dB/decade were classified as flat dynamics, >4 dB/decade were high-pass, and < −4 dB/decade were low-pass.

