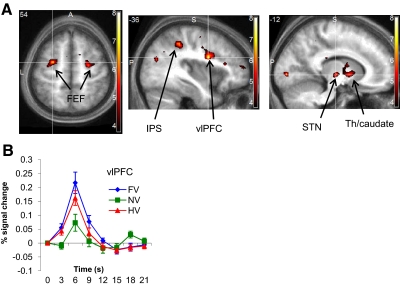
Fig. 3.
Cost-related brain activity. A: axial (z = 54) and saggital (x = −36 and −12) sections showing brain activations reflecting the main effect of asymmetric cost [(FV + HV) >2NV], averaged over category. Shown are significant clusters in left ventrolateral prefrontal cortex (vlPFC), intraparietal sulcus (IPS), bilateral frontal eye fields (FEFs), and subcortical regions (STN, subthalamic nucleus region; Th, thalamus; see also Table 1). Labeled activations are significant at P < 0.05, cluster family-wise error (FWE) whole-brain corrected. B: hemodynamic response time courses aligned to stimulus onset for the 3 different cost conditions, plotted for the significant cluster in vlPFC.

